
New Census data arrived back in August, a decadal event for demography nerds that's on par with Chinese Democracy dropping for GnR-heads.
For Minnesota, the biggest Census headline came a few months earlier when we learned the state won't lose a U.S. House seat, as was feared by many. The margin? Eighty-nine people! August's data dump revealed a lot more, including, per the Metropolitan Council's wonderfully visualized report:
- The greater 15-county Minneapolis-St. Paul metro remains the 16th largest in the U.S., having grown a respectable 11% over the past decade. Watch your ass, Portland, Oregon!
- Since 1990, the seven-county area has boomed by 875,000 residents—from 2.3 million to 3.2 million—representing 38% growth. The carrot that's luring folks here, according to the Met Council? "Economic prosperity." Minneapolis and St. Paul account for only 17.3% of that population spike, with the rest taking place in the 'burbs and exurbs.
- Speaking of 'burbs, among the top overall 10 T.C. growth leaders, Woodbury exploded by 274% over the past 30 years; Shakopee by 272%; and Lakeville by 180%. Unlike Racket, the U.S. Census Bureau didn't have the courage to talk shit about Chanhassen.
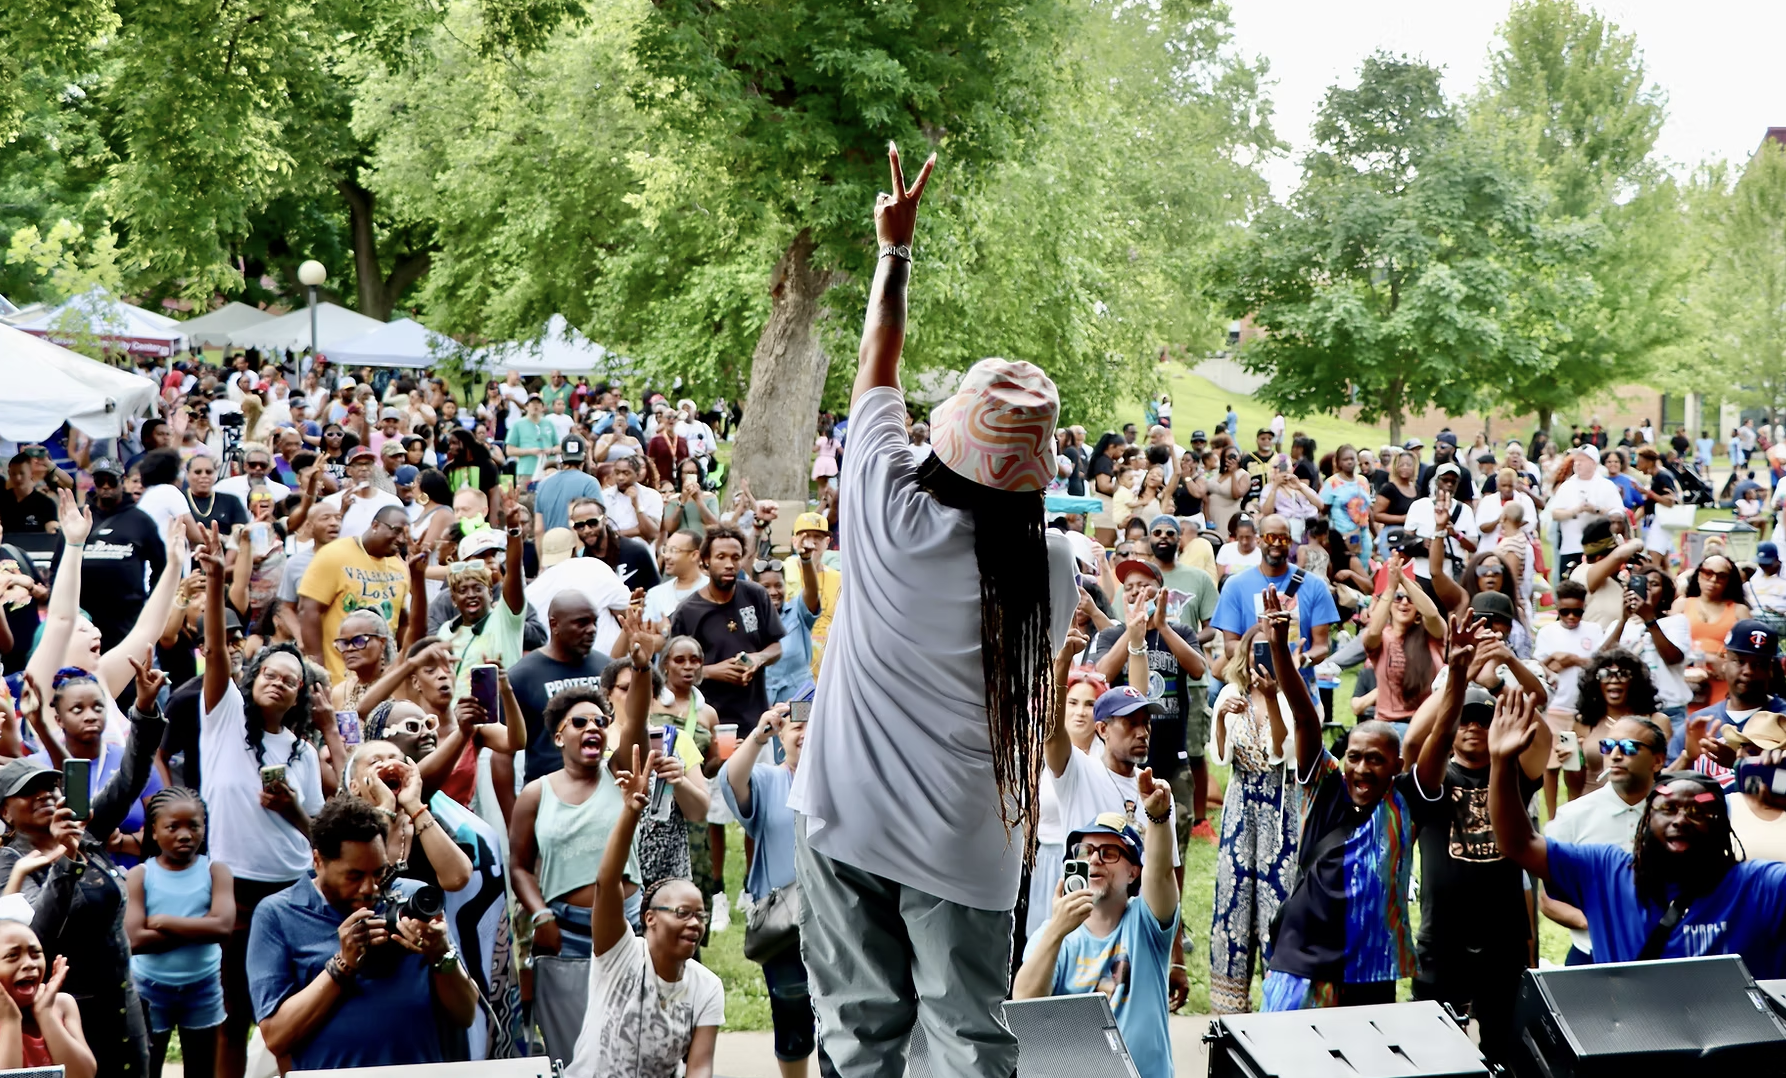
- In 1990, Twin Cities residents identifying as BIPOC represented just 9.3% of the total population. Today that number has soared to 31.2%, and analysts expect it'll hit 44% by 2050. Much of that growth occurred in diverse first-ring suburbs like Brooklyn Park, Brooklyn Center, and New Hope.
- State-wide, Carver (17.4%), Scott (16.2%), and Wright (13.3%) saw the most growth, MPR reports, while Koochiching (-9.4%), Yellow Medicine (-8.7%), and Kittson (-7.6%) shrank the most.
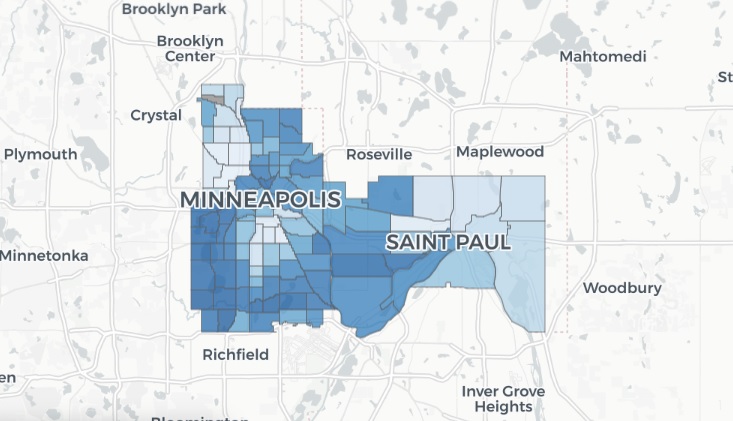
Which brings us to the timely element of this blog post: The Met Council's new interactive map that allows you to explore census numbers neighborhood by neighborhood. By selecting the "Neighborhoods" setting, users can track changes in populations, households, diversity, and density from 1990 through today in Minneapolis and St. Paul. (True geeks can even parse the numbers via block groups and land tracts.)
It might surprise you, for instance, that the East Harriet neighborhood shrank by 8.5% over the past 30 years, while most of south Minneapolis grew. It might not surprise you, however, to see that the lakes area southward to southwest Minneapolis—the so-called "Golden Crescent" bloc that reliably votes for Jacob Frey-types—mostly includes 80%-plus white neighborhoods. It will surprise most to know the prideful author's neighborhood, "Fightin'" Field, has lost 2.93% of its residents since '90, though a new cocktail room, Wisconsin-style supper club, and vegan chicken shack have more and more people declaring it "the hottest lil' 'hood in south Minneapolis."
Anyway, TGIF. Have fun poking around the map; the tool provides a neat hyper-local reading of the city.